I’ve sat across from enough Shopify founders to know the exact moment it happens. You open Meta Ads Manager, see a “3.2x ROAS” badge sitting smugly at the top of a campaign, and feel good about your morning. Then you open Shopify and the revenue number for that same week doesn’t line up at all.
That gap isn’t a glitch. It’s how return on ad spend (ROAS) is calculated, and almost nobody explains it properly. This post breaks down the formula, why your platform’s number lies to you a little, and what counts as genuinely good ROAS for your specific business.
Key takeaways
- ROAS = revenue from ads ÷ ad spend. That’s the whole formula.
- There’s no universal “good” ROAS. It depends entirely on your margins.
- Your ad platform’s reported ROAS and your real Shopify revenue almost never match exactly, and that’s expected, not a tracking failure.
What ROAS actually measures
ROAS tells you how much revenue you got back for every rupee you spent on ads. If you spent ₹10,000 and those ads drove ₹40,000 in sales, your ROAS is 4, or “4x.”
The basic formula
ROAS = Total revenue from ads ÷ Total ad spend
So if you spent ₹50,000 across Meta and Google last month, and you can attribute ₹1,50,000 in Shopify revenue to those campaigns, your ROAS for the month is 3x. Simple enough on paper. The complications start the moment you try to figure out which revenue actually came from which ads.
Why your Ads Manager ROAS doesn’t match your Shopify revenue
This is the part that trips up almost every store owner I’ve talked to. A few reasons the numbers diverge:
- Attribution window: Meta’s default attribution window often credits a sale to an ad if someone clicked it up to 7 days ago, or even just viewed it without clicking. Shopify only sees the order, not which ad “deserves” credit.
- Returns and refunds: Ad platforms count the sale the moment it happens. They don’t subtract it if the customer returns the product two weeks later. Your real revenue does.
- COD orders: For Indian D2C brands, cash-on-delivery orders often get counted as a sale in your ad platform before the order is even confirmed or delivered, let alone paid for.
- Cross-platform double counting: If a customer saw your product on both Meta and Google before buying, both platforms may claim that sale in their own Campaigns tab, inflating combined ROAS if you simply add the two numbers together.
- Discount codes: A ₹2,000 order with a 30% off code didn’t actually bring in ₹2,000. Your ad platform doesn’t know that.
None of this means the platforms are broken. It means platform-reported ROAS is a directional signal, not an audited number.
What’s a good ROAS for a Shopify store?
This is the question I get asked most, and the honest answer is: it depends almost entirely on your margins.
| Margin tier | Typical product examples | Realistic “good” ROAS | Why |
| Low margin (10–20%) | Groceries, electronics accessories | 4x or higher | Thin margins need a large revenue multiple just to break even on ad spend |
| Mid margin (20–40%) | Apparel, home goods | 2.5x–4x | Standard range for most D2C categories |
| High margin (40–60%+) | Beauty, skincare, jewellery | 1.5x–2.5x | Can stay profitable even at a lower revenue multiple |
A 2x ROAS can be wildly profitable for a skincare brand running 60% margins, and a slow bleed for a grocery brand running 15% margins. The multiple means nothing on its own.
Calculating ROAS step by step
- Pick a time window. Weekly is good for spotting trends, monthly is better for decisions, since it smooths out random spikes.
- Pull total ad spend across every platform you’re running, not just your top one.
- Pull total revenue attributed to ads for that same window, from each platform’s own reporting.
- Subtract returns and refunds if you want your true ROAS rather than the optimistic, platform-reported version.
- Divide total revenue by total spend. That’s your number.
Common mistakes that quietly inflate ROAS
- Counting branded search or organic revenue as “ad-driven” because it happened in the same week as a campaign
- Mixing currencies across platforms without converting them first
- Treating a COD order as confirmed revenue before it’s actually delivered and paid for
- Ignoring the margin impact of discount codes when judging whether a campaign is “working”
- Adding Meta’s reported ROAS and Google’s reported ROAS together, when both may be claiming credit for the same sale
A simpler way to track this without the spreadsheet juggling
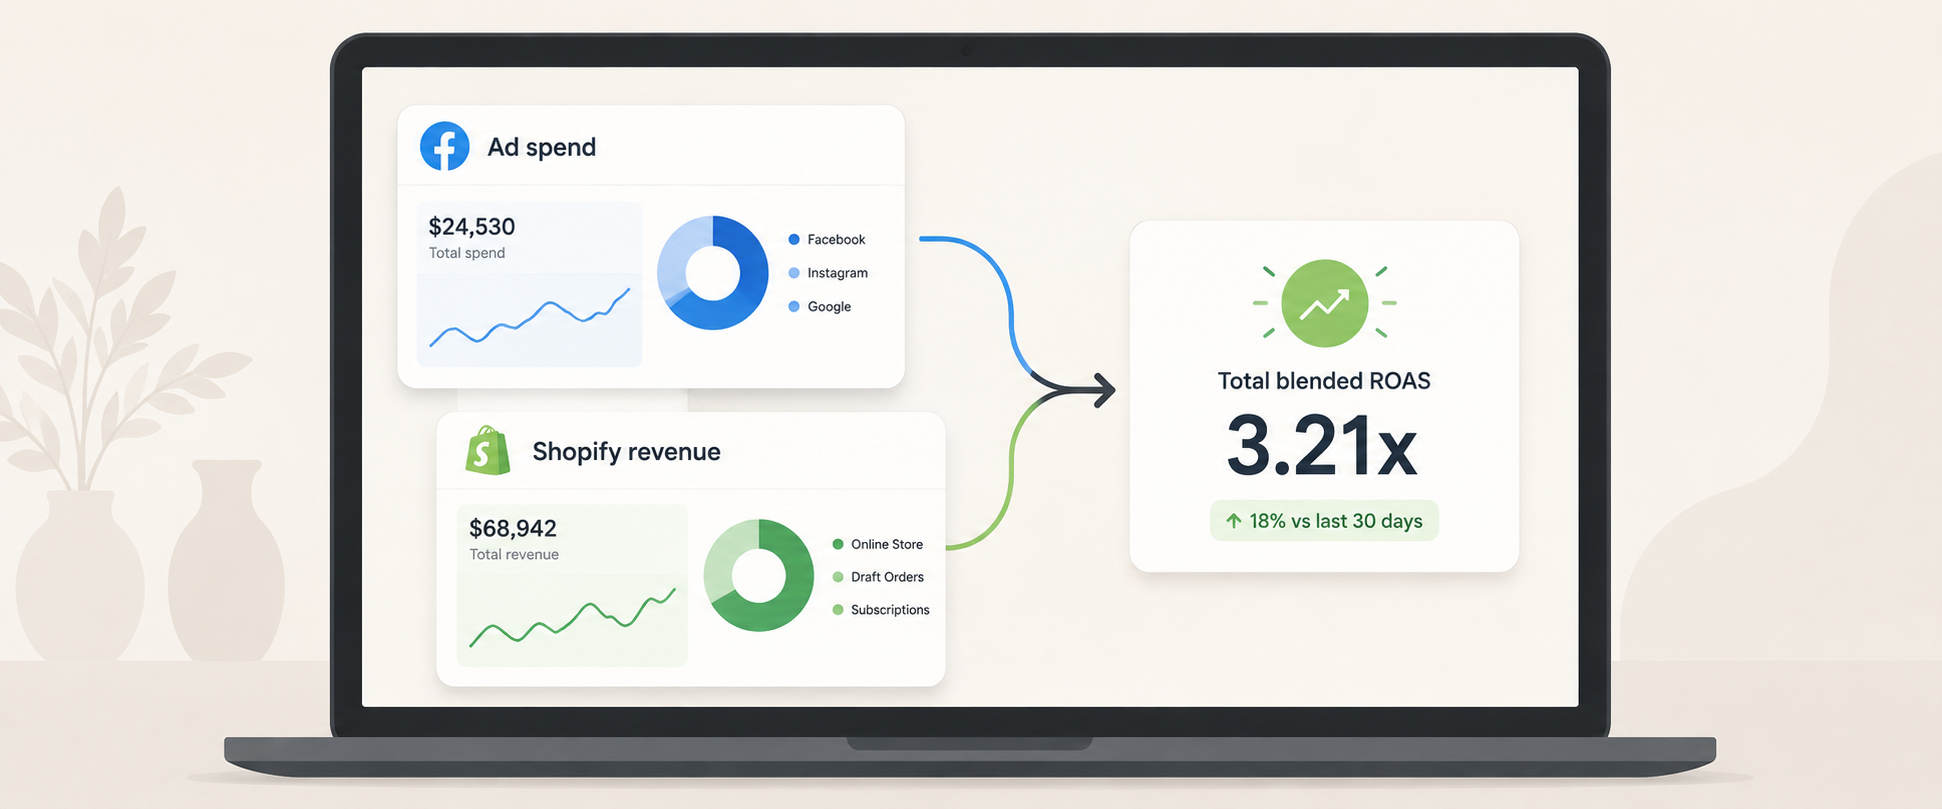
Most of the founders I talk to aren’t getting this wrong because they don’t understand ROAS. They’re getting it wrong because pulling spend from two or three ad platforms and reconciling it against Shopify revenue by hand, every week, is tedious enough that shortcuts creep in. That’s the exact gap Code Metrics is built to close: ad spend and Shopify revenue, in one place, without the manual reconciliation.
Conclusion
ROAS is a useful number, but only once you stop trusting it blindly. Calculate it yourself, adjust for your real margins, and treat your ad platform’s badge as a hint rather than a verdict. If you’d rather see your actual Shopify revenue and ad spend side by side without rebuilding this math every week, Code Metrics does exactly that.
Frequently asked questions
- What is a good ROAS for a Shopify store?
There’s no fixed number. As a starting point, aim for at least 2x–4x depending on your margin, then refine based on your own breakeven math rather than an industry average. - Is ROAS the same as ROI?
No. ROAS only looks at revenue against ad spend. ROI factors in your actual profit after costs like product, shipping, and platform fees, which makes it a better measure of real profitability. - How often should I calculate ROAS?
Weekly for spotting early trends, monthly for actual budget decisions. Daily ROAS swings too much to be useful on its own. - Does ROAS account for GST or other taxes?
Not by default. Most platforms report ROAS on gross order value, so if you want a tax-adjusted view, you’ll need to calculate it separately. - What’s the difference between ROAS and MER?
ROAS is usually calculated per platform or campaign. MER (media efficiency ratio) looks at total revenue against total marketing spend across every channel, which gives you a more honest, store-wide picture.